Edwige Vannier
LATMOS, France
Title: Using digital elevation models and image processing to follow clod evolution under rainfall
Biography
Biography: Edwige Vannier
Abstract
Statement of the Problem: Analysis of soil roughness is a key point in soil sciences for soil preparation as well as for impact studies on overland flow and erosion. Soil roughness changes with time, because of tillage and rainfall. Roughness is usually estimated by various indices, computed on measured profiles or images of elevations. Another approach is focusing on soil clodiness, either by sieving or by image segmentation. The purpose of this study is to follow the evolution of clods under rainfall with digital elevation model (DEM) recording and image processing.
Methodology & Theoretical Orientation: Artificial soil surfaces were made in the laboratory with silt loam soil topped by pre-sieved clods. They were then subjected to controlled artificial rainfalls, and DEM were recorded at each stage of the surfaces. We performed automatic clod segmentation and measurement of the volume of individual cloud.
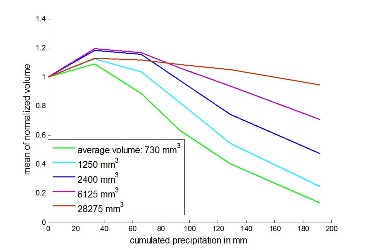
Findings: The clods of diameter superior to 12 mm show swelling (volume increase) and erosion (volume decrease), with cumulated rainfall. These two phenomena seem to be size dependent. When modeling volume decrease by an exponential function, the slope parameter shows a hyperbolic behavior, as a function of a mean volume of the clod subset.
Conclusion & Significance: Monitoring of clod volume with cumulated precipitation with the help of DEM measurements can differentiate the dynamics of clod depending on their size. These techniques improve the usual roughness description and allow for a better understanding of the processes.

Figure 1: Evolution of the mean clod volume under rainfall effect for subsets of increasing clod volume

