

Biography
Biography: Ivan G Torre
Abstract
Fractal geometry has been increasingly applied to quantify soil structure using fractal parameters due to the complexity of the soil structure and thanks to the advances in computer technology. Mass dimension fractal analysis can be implemented in a binary image, which in general is displaying two phases: pore and solid. However, it has been shown that there is variability in the local porosity, which could be better studied using multifractal analysis (MFA). This type of study has been increasingly applied to quantify soil structure and is becomingly popular. We have applied two different techniques of MFA: box counting (BC) and gliding box (GB). The first one BC combines pixels to form larger, mutually exclusive boxes each containing a different set of pixels, while GB constructs samples by gliding a box of a certain size over the grid map in all possible directions. We show that there are some advantages and handicaps in both methods. From a CT-scan 3D image of a soil aggregate sample, three slices from each main direction have been selected. Then, for each slide we have computed using GB and BC, the mass function, the generalized dimension and the multifractal spectrum. All images analyzed presented a multiscaling character pointing out that the lower grey values are mainly influencing the scaling behaviour. The multiscaling nature of these images suggests using these algorithms as a basis to create synthetic images for testing thresholding algorithms.
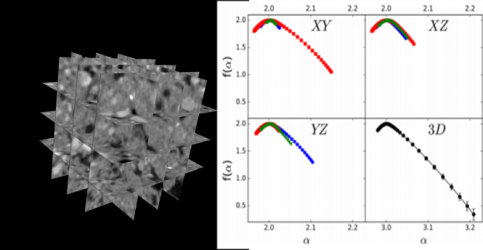
Figure 1: On the left: visualization of some slices from the three main directions of the soil sample used in the study. On the right: Multifractal spectra of all the 2D slices (both above and lower left), and the 3D sample (lower right). Blue circles, red boxes and green triangles corresponds to different slices in each direction.